Excel function to generate numeric UID for person name and pseudonymise data

Excel function to generate a numeric unique ID (UID) for a person’s name.

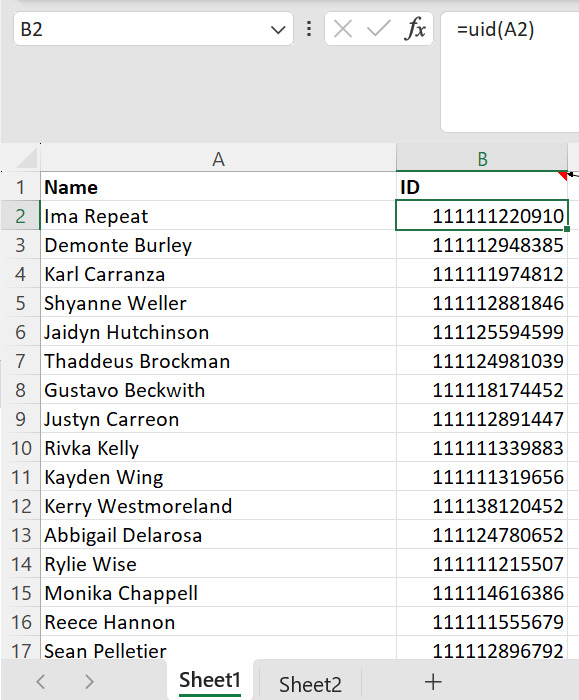
This simple Excel function magically generates a numeric unique identifier (UID) for each name in a data set.

It’s not just creating a random number for each name because the same name generates the same number each time.

And it’s not just assigning each name one of a handful of numbers because there are as many different numbers as there are names – as proven by the counts in D1 and E1 of the worksheet below.

Checking UIDs are in fact unique for your data set.

But where’s the documentation for this magic Excel “uid” function? And why would we even need it? Well let’s get into it. 

Sometimes we need to store or present data about people without revealing any of their personally identifiable information (PII) like name, date of birth (DoB), address, email address, phone number, etc. but at the same time presenting a consistent and true picture of each person’s data. For example person 1 is a 6 foot 35 year old male from London and person 2 a 5 foot 82 year old woman from Edinburgh. This is commonly referred to as pseudonymous data, rather than anonymous data.

Pseudonymous data is data that has been de-identified from the data’s subject but can be re-identified as needed. Anonymous data is data that has been changed so that reidentification of the individual is impossible. Pseudonymisation is the process of replacing identifying information with codes, which can be linked back to the original person with extra information, whereas anonymisation is the irreversible process of rendering personal data non-personal, and not subject to the GDPR.

So we could create a simple mapping table with a number assigned to each individual person but that requires:

  1. creating and then storing the mapping
  2. ensuring we map just the unique individuals in our data so we have just one number per individual 
  3. maintaining and adding to the table every time a new person is added.

All rather cumbersome and time consuming.

What we could really do with is some function that magically converts their full name (or full name plus whatever other piece of data we hold about them, like DoB, to uniquely identify an individual) to a unique identifier – ideally numeric, which is easy to store and look up.

So here’s an Excel user-defined function that creates a reasonably unique numeric id or more accurately hash for a person’s full name.

I say reasonably because it’s not perfect and collisions are possible, by which I mean two different names could result in the same numeric ID being generated.

You create it using VBA (the programming language that comes as standard with Excel) and can then use the function in a cell just like any other built in Excel function. It can look as simple as this:

Excel UID user-defined function.

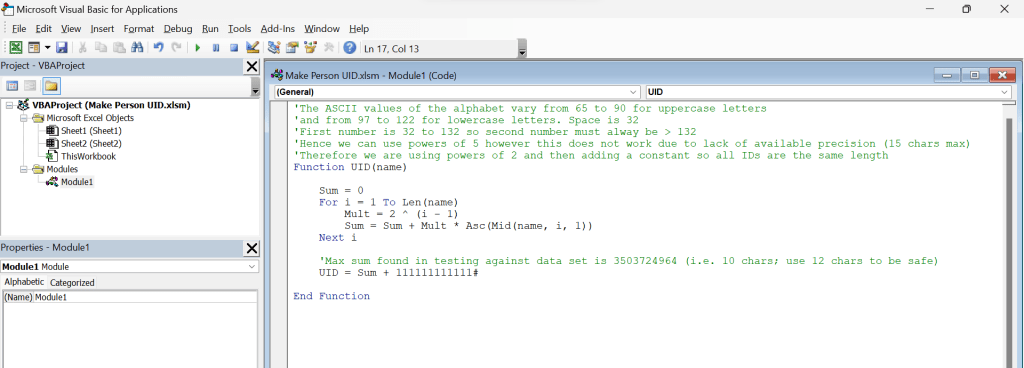
This function encodes each character of the name, together with the position of that character in the string. Each position would ideally generate numbers of a different scale so when added up they won’t interfere with the numbers from other character positions.

So to try to visualise this, if we used a 2-digit number (e.g. A=65) to represent each letter of the name then we could have the number for the name’s first letter occupy the units and tens columns of our UID, multiply the number for the name’s second letter by a hundred so it occupies the hundreds and thousands columns of the UID, multiply the number for the third letter by ten thousand and so on.

This idea is not novel e.g. an algorithm like this is considered here: Stackoverflow.com

The problem with this is that in Excel we can only record 15 digits of precision in a number so quickly run out of numbers meaning we can only record names up to 7 letters long.

By 15 digits of precision I mean that, if you have a number over 15 digits long not all of its digits are actually stored. For example, after 1 quadrillion (1,000,000,000,000,000) you lose the ability to store units so 1,000,000,000,000,001 is actually treated and stored in Excel exactly the same as 1,000,000,000,000,002 which increases the chance of collisions. You can see this for yourself by typing each of these numbers in different cells and entering a formula to subtract one from the other. You will see a difference of 0. Yes, Excel can lie to you!

To address this we use a smaller multiplier so we can encode a longer sequence of letters within the 1 quadrillion limit, however it is then possible for a character at one position to be encoded as exactly the same number as a character in a different position so there isn’t in fact a different total for every single permutation of letters one could encode, although the chance of two names in one’s actual dataset sharing the same total is low.

For example _A (a space followed by A) generates 32 + 2*65 = 162 but so does b_ (b followed by a space). 

Now this UID function could in fact be used with any string but there is a limit to the length of the string before collisions become more likely and it is designed for text up to around 30 characters i.e. the typical maximum length of a person’s full name (first name and surname).

You could experiment with increasing the character position multiplier to reduce or eliminate the chance of collisions but that results in the generated ID number requiring more than 15 digits of precision more quickly as names get longer, which then increases the possibility of collisions so it’s swings and roundabouts.

Clearly there is a trade off between the length of string you can generate a UID for and the risk of collisions.

With real person names and datasets in the low hundreds of names I’ve found in its stock form it does a pretty good job of coming up with a different ID for every different name, though there is lots of room for further optimisation – possibly at the expense of more complicated code.

For example, you could imagine simply using an if else clause to assign a different number for every single real world known name. There are apparently around 30,000,000 different surnames and around 30,000,000 firstnames and hence 30,000,000 squared (9e+14) combos of first and last name – so with 15 digits we could perfectly encode every single one of those combos. The code for such a function would however be horrendous!

If you don’t need a purely numeric identifier then generating an alphanumeric identifier (i.e. including letters as well as numbers) would of course allow even more numerous representations within a given code length, however, again at the expense of more complicated code.

If you come up with a more efficient code generator that deals with longer names or reduces collisions please do leave a comment. 

With this simple, and hence quick to run, function, although a unique ID is not guaranteed for each different name, you can easily and quickly test whether the function does in fact create unique IDs for your specific data set by running it for each person it contains (simply fill the function down as shown in the first screenshot above) and seeing whether you get the same number of unique IDs as you have unique individuals.

Just do an advanced filter on unique records for firstly the names of the individuals and then the generated IDs of those individuals and check whether there is the same number of rows of each – or alternatively use the Excel COUNTA and UNIQUE functions in combination as shown above (note that we use COUNTA rather than COUNT since COUNT only works with cells containing numbers and dates but not text).

If it doesn’t then you should be able to tweak the function’s code slightly so it does generate a unique ID for each name in your particular data set.

Now, considering your original data set, if your person full names, by themselves, don’t uniquely identify individuals you can concatenate to their name another piece of information about them, for example their DoB, and then run the function against that concatenated string.

Finally you can add a constant of your choosing to the number generated by the function to make all the IDs a consistent length and further obfuscate the relationship between name and ID.

Note: In VBA if we declare a variable without specifying the data type then the Variant data type is assigned by default (which requires more memory resources than most other variables). Types also have a shorthand and # is the shorthand for double. For more details see Data Type Summary.

You can change the function to make it easier to find individuals through their pseudonymised ID e.g. adding their initials before the generated number to make it easier to find a specific individual across various data sets. As a bonus, this also increases the uniqueness of the generated ID though of course the addition of alpha characters means that a numeric field can no longer be used to store the ID.

Just remember that if you change the function you then need to manually recalculate any cells that have already used your user defined function, by pressing ctrl-alt-f9 to force a workbook-wide recalculation. Pressing f9 alone is not enough, since that only recalculates cells marked as ‘dirty’ i.e. which refer to cells whose value has changed since the last calculation.

So, there you go. An approach to creating a simple Excel function that generates a unique number for every person name in your dataset.

Enjoy – and for more tech and wellbeing at the lowest price please subscribe 🙏

https://youtube.com/@GIChow

Pandasql broken in Google Colab – Quick fix

Pandasql AttributeError

Last week a time-saving Python program I had been running successfully for several months in the Google Colab Jupyter notebook environment suddenly failed with a curious error.

https://stackoverflow.com/questions/75464271/attributeerror-str-object-has-no-attribute-execute-on-connection

The cause – an upgrade to a package (SQLAlchemy) that a library I was using (pandasql) depended upon had broken the library.

This was rather concerning since I had written a huge volume of code using the library and refactoring the code to do things a different way would have been a not insignificant undertaking.

Happily there are a couple of fixes. One is proposed in the link above which is to downgrade the package the broken library depends on before installing the library:

!pip install --upgrade 'sqlalchemy<2.0'
!pip install -U pandasql

This is not entirely satisfactory since one can imagine a time when that downgraded version is no longer supported.

Ideally a fix would be released to pandasql itself but despite its popularity and widespread use it seems no changes have been made to it for several years so what are the chances of that happening..

https://github.com/yhat/pandasql/issues/102

Alternatively, we can use a forked ‘fixed’ distribution of pandasql that someone has kindly created:

https://pypi.org/project/pansql

Pandasql fix

and simply install that fixed distribution (instead of pandasql) and then import the modules needed from it:

#!pip install -U pandasql
!pip install -U pansql
#from pandasql import sqldf
from pansql import sqldf

There may be debate about whether to use SQL and pandasql against dataframes, when other mechanisms to query their data are available:

https://www.reddit.com/r/bigdata/comments/oklwgk/pandasql_the_best_way_to_run_sql_queries_in_python/

Regardless of such stylistic, philosophical and aesthetic considerations, SQL remains one of the most established and popular languages for querying tabular data and rewriting existing code to use alternative methods, like the pandas query function can be time-consuming and will certainly require retesting.

https://towardsdatascience.com/10-examples-that-will-make-you-use-pandas-query-function-more-often-a8fb3e9361cb

I’ve experienced these unexpected failures of previously working code on occasion before e.g. where a package was completely removed from the base Colab distribution.

https://github.com/googlecolab/colabtools/issues/3347

Happily the community developed a fix in that instance too.

So, running Python programs on Google Colab’s ever changing foundation remains a rather nerve wracking experience with unexpected work being required from time to time when things suddenly break and you need to research, implement and test fixes. If you know a better approach to managing the relentless and inevitable changes to Colab please leave a comment!

Being fat keeps us fat

Being overweight actually keeps us feeling unsatisfied and overweight

Inflammation increases with weight gain, which leads to insulin resistance and leptin resistance. So, if you’re looking to lose weight, reducing inflammation is key. You can do this by avoiding processed foods and added sugars, eating more anti-inflammatory foods, getting enough sleep and decreasing stress levels. Reducing the amount of inflammation in your body will also lower your risk for diseases like cancer, heart disease and diabetes.

There is more to long term health and weight maintenance success than calories in and calories out. Check out these conversations by 2 London hospital doctors.

https://www.medtronic.com/covidien/en-gb/clinical-solutions/bariatric-solutions/obesity-the-big-truth.html

For laypersons check out this article by a dietician.

https://www.eatingwell.com/article/2058068/inflammation-might-be-the-reason-youre-not-losing-weight-here-are-5-things-you-can-do-about-it/

In a nutshell these resources help us understand the need to put good foods in (leafy greens, broccoli/cauliflower, nuts, fatty fish) as much as avoid bad foods.

How to lose weight

I wonder whether we may ‘self-medicate’ and become fat exactly in order to reduce our metabolism, feel tired and hence reduce troublesome thoughts.

It’s not easy. Good luck! All the best for now.

The true size of every country

World map with true country sizes

This Nature article illustrates the distortion to our perception of the world introduced by the map most of us are familiar with.

The world map we know makes objects closer to the poles appear larger so Greenland looks the same size as Africa which is 14x bigger.

The 6 largest countries by size are Russia, Canada, China, the US, Brazil and Australia.

Largest countries by area
Largest countries by population

Both these maps put the UK at the centre of the world for historical reasons. The links below provide further perspectives and details.

https://en.m.wikipedia.org/wiki/List_of_countries_and_dependencies_by_area

https://www.worldometers.info/world-population/population-by-country/

https://www.worldometers.info/geography/largest-countries-in-the-world/

Best TV picture of 2023: LG G3, Samsung S95C, Panasonic MZ2000, Sony A95L..or something else?

Which TV will have the best picture quality in 2023? There is a lot of talk about the headline flagship sets from the consumer electronics arms of the OLED panel manufacturers, LG and Samsung, with Sony’s A95K QD-OLED successor yet to be announced, but the truth of the matter may just have been staring us in the face all along.

Let’s summarise what some of the biggest TV YouTubers and Audio-visual websites have to say before reaching a conclusion.

Best TVs of CES 2023 (Caleb Denison)
  • Samsung S90C / S95C has potential for greater colour brightness and luminance if pushed
  • LG G3 META Micro Lens Array improves brightness but not necessarily colour brightness because of the white subpixel however he found colours to be brighter perceptually
  • Panasonic MZ2000 processing and picture quality made it one of the best at CES 2023
  • MLA just focuses existing light better rather than increases light energy so doesn’t increase burn in risk
  • MLA peaks at 2100 nits so a ‘150% increase’ (2.5x original or 1.5x original?)
  • QD-OLED2 colour brightness is measurably purer since no white subpixel but perceptually MLA may appear little different
LG G3 is 70% brighter (Vincent Teoh)
  • LG Brightness Booster Max light control architecture (MLA) and light boosting algorithms increase brightness by up to 70% but just on 55, 65, 77 inch models (not 83)
S95C
  • Samsung puts Micro LED top of its range with, OLED bottom and Neo QLED in the middle.
  • S90/95C in 55, 65, 77 inch sizes
Measured first MLA
  • MLA is brighter across all window sizes from 1% to full screen white giving more depth and punch and brighter colours
  • Panasonic MZ2000 1500 nits (cd/m2) peak light output on a 10% window
  • Graph shows 50% brightness boost over previous year’s LZ2000 at 10% window size but reducing to just 20% brightness boost at 100% window size.
  • Though brighter MZ2000 clears image retention quicker than LZ2000
  • Some scenes look identical in brightness on old LZ2000 and new MZ2000
  • With ambient light blacks look less black and more pink on the new MZ2000
Panasonic MZ2000 MLA
  • MLA design uses 27 billion lenses to redirect out of the screen light previously reflected inwards
  • Brightness is 50% greater than last year’s model
  • MLA increases colour volume
  • “True to the film maker’s vision” slogan – even though film makers take into account typical end user equipment
QD-OLED 2nd generation
  • 30% brighter over 2022 QD-OLED due to higher intensity light and less internal absorption
  • Blacks will be truer than the greys of QD-OLED v1 due to optimisation of the top layers of the panel
CES 23 Best Tvs
  • LG MLA and Samsung QD-OLED2 are the main technologies impacting top end picture quality for 2023.
  • TCL Micro LED promises the best picture quality but is 5 years plus away
  • Panasonic MZ2000 with MLA is vote for best of show with a visible difference against last year’s model
  • Wireless HDMI is on the LG Signature OLED M model
LG G3 vs Samsung S95C matchup (FOMO)
  • G3 Micro Lens Array (MLA) will achieve the best full screen brightness
  • S95C QD-OLED has a brighter blue OLED material and a new anti reflective layer will reflect less light and so achieve truer blacks in a brighter room than its predecessor (OLED v1 also used by Sony A95K)
  • LG G2 issues were full screen brightness, uniformity (magenta tint) and colour accuracy
  • Samsung S95B issues were lifted blacks under ambient light, low bit rate content processing and bent panels
  • The competition will be about high APL brightness and lower luminance colour accuracy
LG MLA G3 vs Samsung 2023 QD-OLED | Really 2000 Nits? (Classy)
  • Marketing materials don’t specify the brightness window sizes
  • Panel may be capable of 2000 nits but the implementation in the models may be less
  • Forbes states QD-OLED v2 is 1500 nits at 10% and a 30% improvement over the previous year.
  • QD-OLED issues remain: colour fringing with coloured lines in bright scenes and near black smearing.
  • LG G3 1500 nits on 10% window and 2000 on 3%
  • Both Sony A95K (QD OLED with heat sync) and Samsung S95B (without heat sync) holds sustained brightness better though does not get so bright as LG G2.
  • Panel consistency and lack of pink tinting are the main advantages of QD-OLED over OLED.
G3 v S95C (Brian)
  • Samsung updates in 2022, presumably to keep the panel safe, meant the S95B no longer offered its original brightness by the end of the year
  • QD-OLED2 is trying to be brighter than MLA (2100 v 2000 nits)
  • LG Evo G2 panel had a pink tint uniformity issue and Samsung QD-OLED S95B panel had a software update trust issue
Second generation OLED (KG)
  • At CES 2023 the Samsung booth demonstrated QD-OLED v2 as being perceptibly brighter with even more saturated colours than 2022 QD-OLED.

RTINGS.com provides measurements for several popular TVs and top of the line LEDs measure and are perceived as much brighter and more impressive with bright full screen scenes than top of the line OLED TVs, whether WRGB OLED or QD-OLED.

For 10% peak and 100% sustained brightness respectively, RTINGS.com gives

  • OLEDs: LG G2 (evo) 450, 190; Sony A95K (QD-OLED) 410, 148; LG G1 (2021) 406, 161
  • Mini LEDs: Samsung QN95B 1,934, 569; Sony X95K 1223, 633;
  • Full Array Local Dimming: Sony X95H (2020) 1085, 625

So to summarise, the latest 2023 OLEDs are 30% to 50% brighter than last year for sub 10% white windows but for full screen white are perhaps just 20% brighter so for viewing in a daytime room or bright high APL scenes with, for example, sunshine, snow or sports both of the new OLED technologies, QD-OLED v2 and MLA (META), remain much less impactful than LED designs.

Micro LED achieves the holy grail of professional reference mastering monitor black and bright performance like the 31 inch Sony BVM-HX310 but is too expensive a technology for mass market consumer sets for now and several years to come, with lower energy consumption being one of the technical challenges needing to be overcome.

How Excel bins handle decimals when using FREQUENCY

How Excel bins handle decimals

Each bin defines the absolute maximum number the bin can contain. A bin of 10 will contain numbers up to 10 so 9 and 10 but not 10.1. In other words, the bin contents are less than or equal to (<=) the current bin and greater than (>) the previous bin.

In short a bin contains numbers up to and including the bin’s number but not a fraction over the bin’s number as shown in the examples above.

People usually give their age as rounded down and age limits operate in that way too so a 17.9 year old can’t vote in the UK. If we want to find the number of people aged say 15-18 we need to use the Excel ROUNDDOWN function to make sure someone who is 18.3 or 18.9 appears in a 15-18 bin defined as 18. The previous bin in this example would have to be 14 to capture 14 year olds but not 15 year olds.

How many people have spoken to the Queen, Elizabeth II

How many people did the Queen speak to?

A quarter of a million people, or 0.3% of the population of the UK that is alive today, or one in three hundred people in the UK have actually spoken to the Queen.

That figure assumes she spoke to on average 23 new people at each of the 21,000 engagements she attended during her 70 year reign, an average age of her interlocutor of 35, an average lifespan of interlocutor of 75 years (it is 81 in the UK in 2022) and the vast majority of her interlocutors being UK inhabitants.

If we include the 307,000 people she sent a 100th birthday telegram to and the 927,000 couples she sent a 60th anniversary message to that brings the figure up to 2.6 million people in total (alive or dead) she has directly communicated with, though this is an overestimate since there will be overlap between these these cohorts.

Since the written communications were over a period of 70 years, and assuming an average age of the recipient of the written communications of 80, 200,000 could be assumed to still be living, making for up to half a million people in the UK in total who are alive now (2022) having received direct communication from the Queen.

If you have any other thoughts or figures on these estimates please leave a comment below.

Of course, the Queen’s influence was felt by many more people, including myself. Her devotion to duty with good humour and intelligence is just one of the legacies she will leave us with.

May you ever rest in peace Ma’am.

Make diagrams for free

Plantuml Archimate diagram made with Planttext

If you don’t have the funds or inclination to pay for Vizio or Lucidchart here are a few tools for easily creating a variety of common diagrams, from flow charts to entity relationship (data structure), dependency, UML and presentation graphics. Some don’t require any drawing or layout skills whatsoever and allow you to produce clear professional looking diagrams quickly just by typing concise human readable text – no manual and time-consuming drawing, positioning, resizing, formatting and alignment of objects and connectors!

Org Chart

https://slidesgo.com/slidesgo-school/google-slides-tutorials/how-to-create-an-organizational-chart-in-google-slides

https://whimsical.com/organizational-chart-BLVgnvNgT2jxnxui5Xz2Ng

Flow chart

https://slidesgo.com/slidesgo-school/google-slides-tutorials/how-to-create-flowcharts-in-google-slides

https://whimsical.com/swimlane-diagram-NPTsYh6pkkgQ83NbcytwXy

See also Activity diagram for the equivalent in the internationally agreed UML notation.

Activity, Class, Gantt, Mindmap & more

https://www.planttext.com/

Archimate Diagram

Archimate is an internationally agreed standard, in the style of UML, that lets one describe pictorially all elements of Enterprise Architecture from motivation like drivers, goals and outcomes to business processes, data, applications, technology, strategy, capabilities, courses of action (like projects and programmes) and deliverables.

https://plantuml.com/archimate-diagram

All Plantuml diagrams can be constructed, shared and saved via

http://www.plantuml.com/plantuml

and

https://www.planttext.com

however since the URLs are so long (the URL encodes the script that describes the diagram) a URL shortener can be employed for easier sharing and embedding.

https://tinyurl.com/5d258ucc

Tip: change the real URL you land on using the shortened link above from the format

https://www.planttext.com/api/plantuml/png/{long string}

to this format

https://www.planttext.com?text={long string}

to be able to edit the diagram!

Plantuml Archimate Diagram (revised)
Plantuml Archimate Diagram (revised further)

Here is the new URL of the revised diagram, in the SVG format this time, which can be scaled without loss of resolution:

https://tinyurl.com/yck3j9ay

Note: if you change the diagram the URL of your edited diagram will also change, which means that you will need to change the diagram URL embedded in any documents that refer to it if you want them to reflect your edits. Of course, if you simply download and include the generated png file in your document you need to change the document whenever you revise the diagram too. The upside is that anyone can revise the diagram in future without having to recreate it from scratch and without needing any software – just internet access. One isn’t even dependent on a particular website since the ‘long string’ from http://www.plantuml.com/plantuml/uml will also work at https://www.planttext.com and one can even install one’s own diagram server:

https://plantuml.com/faq-install

Class and many other UML diagrams

https://plantuml.com/class-diagram

Also allows one to quickly write:  Sequence diagram  Usecase diagram  Class diagram  Object diagram  Activity diagram (here is the legacy syntaxComponent diagram  Deployment diagram  State diagram  Timing diagram 

ER Diagram

https://graphviz.org/Gallery/undirected/ER.html

https://tinyurl.com/ww27kydz (planttext.com – revise as needed and then embed in your document using the URL you are directed to when clicking SVG)

https://tinyurl.com/dne33z9f (plantuml.com)

Dependency Diagram

These can be very powerful by providing insight into the chain of dependencies and relationships within a system. Graphviz allows diagrams in the simple ‘dot’ graph description language to be constructed, shared and saved via e.g.

https://dreampuf.github.io/GraphvizOnline

http://magjac.com/graphviz-visual-editor/

App Wireframe

https://whimsical.com/web-app-wireframe-MQJZk63o4PSpJES2zPTXLx

Slide Presentation Graphics

https://slidesgo.com/

Icons

https://www.flaticon.com/

Other tools

https://excalidraw.com/#json=4LBOkXcW00pbtBpaCdFkb,1-wmfKsAljpJzKSTAg96ZQ (Amazing! Create diagrams and whiteboard ideas on mobile or desktop; you can even generate a diagram using natural language and subsequently revise it)

https://app.diagrams.net/ (formerly draw.io, fiddly on a phone)

https://docs.google.com/drawings (needs sign up, cumbersome on a phone)

http://dia-installer.de/ (needs installation on a desktop OS so unusable on a phone)

https://www.lucidchart.com (needs sign up, app installation on phone and free version limits documents and objects per document)

Hope this helps – feel free to share your favourite diagramming tools and resources in a comment!

How many MPs are supporting Boris Johnson in today’s vote of No Confidence #HowManyMPsSupportBoris

At least 157 MPs have publicly declared their support for the Prime Minister including those listed in the tweet below.

The latest figure can be seen here: https://twitter.com/johnestevens

The list above may not include some of the latest declarations of support – you can search Twitter for “support prime minister” e.g.

If you have a more up-to-date figure feel free to tweet a reply here.